Daily consumption of pistachios over 12 weeks improves dietary profile without increasing body weight in healthy women
A randomized controlled intervention
This article is presented by SienceDirect.
- Download this Article PDF
1. Introduction
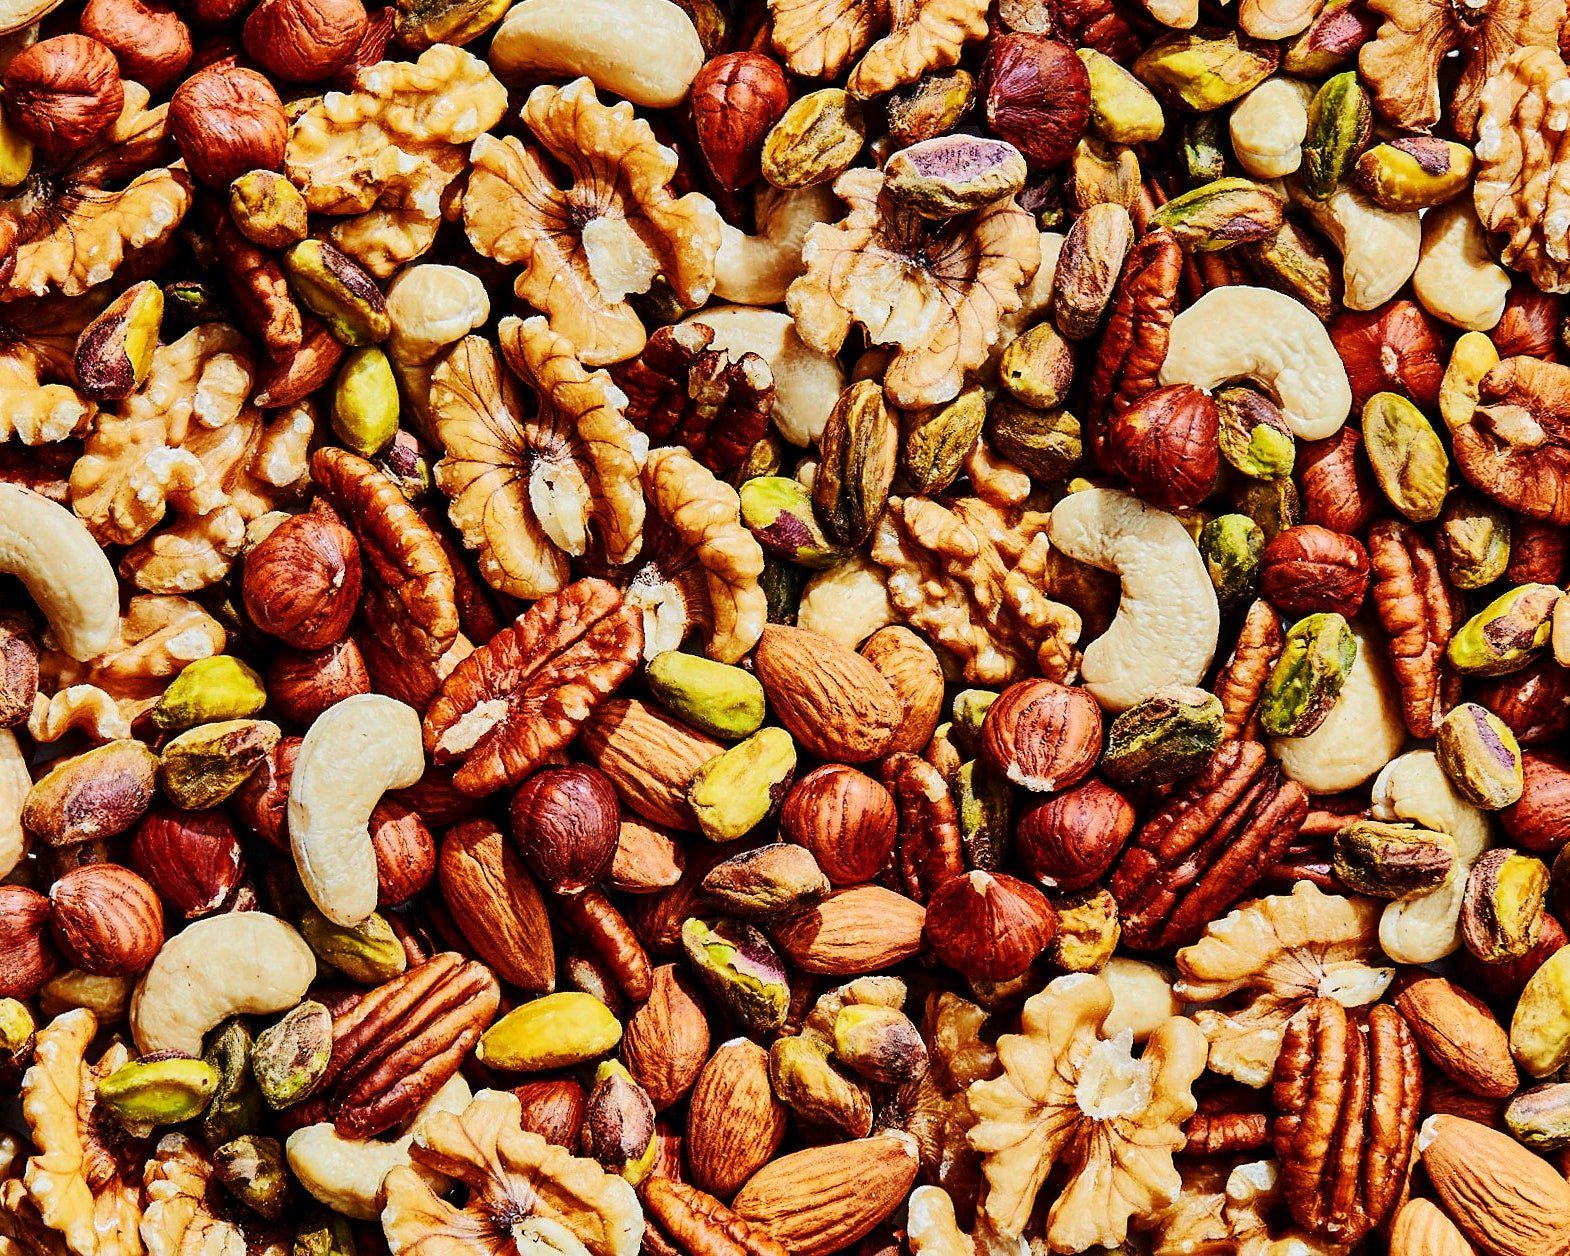
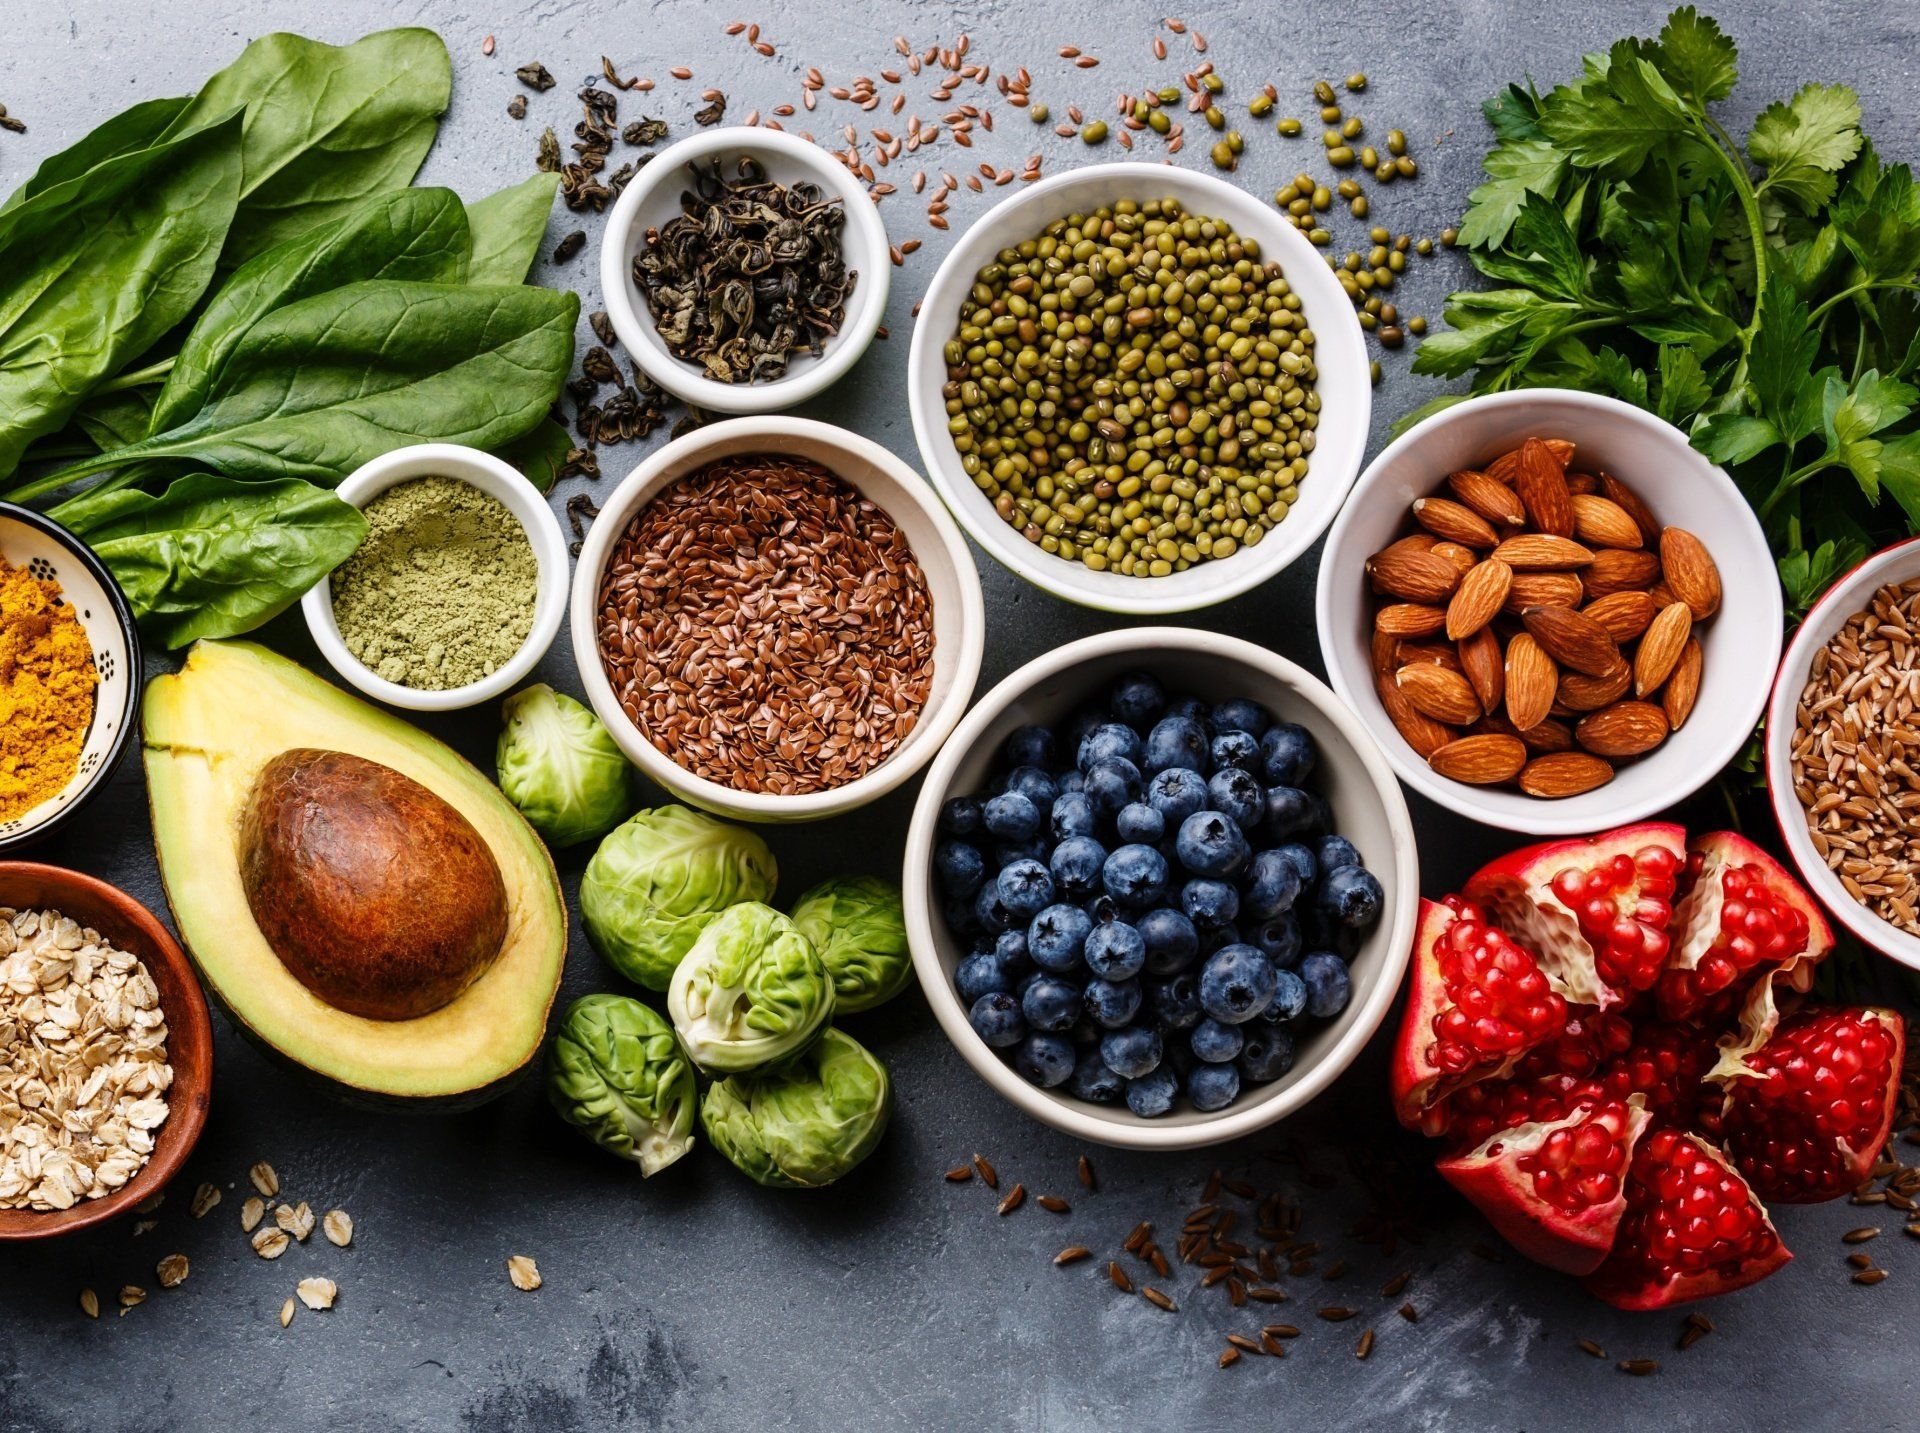
Nuts are nutrient-dense foods, high in protein, fiber, phytosterols, antioxidants, monounsaturated (MUFA) and polyunsaturated (PUFA) fatty acids. Nut consumption is associated with numerous health benefits, including reduced risk of cardiovascular disease and type 2 diabetes mellitus, and of all-cause mortality (Babio et al., 2014; Bao et al., 2013; Grosso & Estruch, 2016; Ros et al., 2014). These benefits have been attributed to the healthful nutrient profile of nuts, particularly in the context of a Mediterranean diet, and their rich content in protective bioactive compounds (Salas-Salvado, Casas-Agustench, & Salas-Huetos, 2011).
In the USA and Canada, recent guidelines explicitly recommend the daily intake of nuts (Dietary Guidelines for Americans, 2015; Health Canada, 2019). In France, the National Program for Nutrition and Health (PNNS) issued an updated set of dietary guidelines in January 2019 (Santé Publique France 2019) which recommend the daily intake of a “small handful of unsalted nuts”, highlighting their content in non-saturated lipids. Walnuts, hazelnuts, almonds, and pistachios are explicitly recommended options.
In addition to their healthy nutrient profile, nuts are also energy dense. Recommending nut consumption raises concerns in terms of weight management in the context of the worldwide epidemic of obesity (Bes-Rastrollo et al., 2009). As a consequence, many weight-concerned consumers, particularly women, may be reluctant to include a portion of nuts in their daily diet. The scientific literature suggests that such concerns are not founded (Tan, Dhillon, & Mattes, 2014). In fact, many large epidemiological studies have reported that nut intake is inversely associated with adiposity and weight gain. The cross-sectional National Health and Nutrition Examination Survey (NHANES) reported an association between tree nut consumption and lower Body Mass Index (BMI) and waist circumference (O'Neil et al., 2015). The Harvard's prospective Nurses' Health Study shows that women who consume nuts more often than twice a week gain less weight and have a lower risk of obesity than peers who seldom consume nuts (Bes-Rastrollo et al., 2009). Evidence from intervention studies provides concordant observations. A meta-analysis of 33 RCTs found no association between consumption of nuts and body weight, BMI, or waist circumference (Flores-Mateo, Rojas-Rueda, Basora, Ros, & Salas-Salvado, 2013).
The absence of weight gain in consumers of nuts suggests the action of adequate compensatory responses, but their precise mechanisms remain unknown. Pistachios, like other nuts, are rich in protein, fiber, and unsaturated fats that may facilitate satiety and elicit compensatory decreases in intake of other elements of the diet (Kozimor, Chang, & Cooper, 2013; Mattes & Dreher, 2010; Natoli & McCoy, 2007). In addition, it has been hypothesized that the fat contained in nuts (such as walnuts, almonds, cashews and pistachios) may be incompletely absorbed following consumption, resulting in an overestimation of their caloric input (Baer, Gebauer, & Novotny, 2012, 2016; Baer & Novotny, 2019; Novotny, Gebauer, & Baer, 2012). The masticatory effort required to eat nuts could also promote satiety (Cassady, Hollis, Fulford, Considine, & Mattes, 2009). A recent meta-analysis (Krop et al., 2018) concludes that prolonged chewing can decrease self-reported hunger and food intake. In agreement with these various satiety mechanisms, RCTs have confirmed a high satiating potency of almonds (Cassady et al., 2009; Tan & Mattes, 2013), peanuts (Reis et al., 2013), and walnuts (Brennan, Sweeney, Liu, & Mantzoros, 2010).
The purpose of the present study was to investigate the effects of adding a daily portion of pistachios to the habitual diet of healthy women. In a randomized intervention, women who were not regular consumers of nuts were requested either to consume 44 g (250 kcal) pistachios as a mid-morning snack, or to go on with their usual diets for 12 weeks. The effects of the pistachio supplementation were examined in terms of changes in body weight (primary objective) and body composition, and various body circumferences. We hypothesized that changes in body weight from pre- to post-intervention would not differ significantly between the two groups.
In addition the satiety induced by the pistachio portion was assessed in all participants in terms of changes in appetite sensations and spontaneous food intake following the pistachio load (secondary objectives). These outcomes were studied under laboratory settings (via a classical pre-load paradigm) and in free-living conditions before and after the intervention, in successive 2-day test sessions. We hypothesized that mandatory intake of pistachios would increase satiety and consequently reduce later food intake. The types of nutrients affected by post-pistachio satiety were assessed as well as the magnitude of the energy adjustment. The associated changes in the nutrient composition of the diet were analyzed (third objective).
Previous studies have compared the effects on body weight of pistachio supplementation versus comparator foods (Carughi et al., 2019; Li et al., 2010). In the present study, we adopted a different design precisely to establish that the daily addition of the pistachio load would not induce weight gain, and this is why we elected to use a non-inferiority analysis compared to a control group not exposed to the challenge of the daily pistachio snack.
2. Methods
2.1. Participants
Volunteers were recruited through advertising in the local community. According to inclusion criteria, participants were healthy, non-obese (BMI 19–29.9 kg/m2), pre-menopausal women aged 18–50 y and who did not typically consume nuts (less than 2 days/week).
A power computation (see detailed presentation below) indicated that 25 participants per group would be adequate to support a non-inferiority analysis of effects on body weight. Potential candidates were first screened by telephone. Then 386 potentially eligible participants were invited to an in-person interview with the research staff. Following medical screening, 63 participants were found eligible and included, however 3 did not return for the first experimental session. The final Intention-To-Treat population (ITT) was composed of 60 women. A flow diagram of the screening, recruitment and enrollment procedures, and participation through the phases of the study is provided in Fig. 1.

Fig 1. Flow diagram showing the phases of the RCT in healthy women.
At the time of the medical screening, body weight and height were measured and BMI (kg/m2) was computed. The Three Factor Eating Questionnaire (Stunkard & Messick, 1985) was administered in order to identify and exclude candidates with excessive Dietary Restraint (cut-off restraint score = 8). Participants were then asked to record their food intake over three consecutive days (2 week day and one week-end day) using standardized food diaries. Mean daily energy intake was computed from the diaries (Nutri-7® software, CIQUAL Food Composition Table, 2017).
All participants signed an informed consent form and were informed of their right to withdraw from the study at any time. The protocol was approved by the Institutional review Board (CPP Nord-Ouest II, ref 2018-5, February 21, 2018), registered and authorized by the French health authorities (ANSM, January 22, 2018, N°ID-RCB: 2017-A03167-46). The study was registered in the Protocol Results Registration System (PRS) at ClinicalTrial.gov (Identifier: NCT03526120). The first participant was enrolled on February 27, 2018 and the experimental procedure ended on July 28, 2018.
2.2. Experimental snack
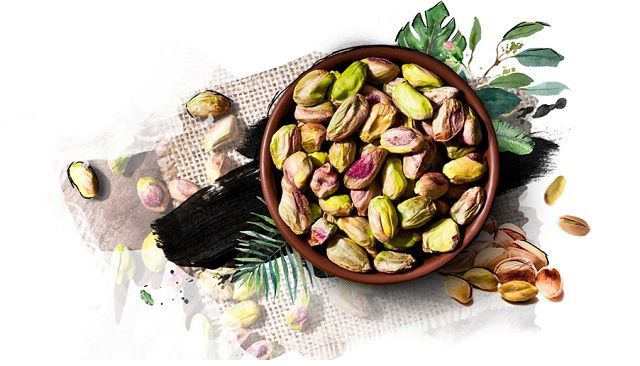
The experimental snacks were composed of a portion of 44 g shelled slightly salted pistachios (edible portion). The pistachios were obtained from American Pistachio Growers, California. The snack provided 250 kcal, 12.8 g CHO, 9.2 g protein, 19.8 g fat and no cholesterol.
Table 1 gives the nutritional profile of the 44 g pistachios snack as well as a 100 g portion. The pistachios were provided in individual pouches without any labelling.
| Nutrient | Unit | 44 g snack content* | 100 g portion content* |
|---|---|---|---|
| Energy (kcal) | kcal | 250 | 570 |
| Protein | g | 9.2 | 21 |
| Total fat | g | 19.8 | 45 |
| Saturated fat | g | 2.2 | 5 |
| Monounsaturated fat | g | 10.6 | 24 |
| Polyunsaturated fat | g | 5.7 | 13 |
| Linoleic acid (18:2) | g | 5.6 | 12.8 |
| alpha Linolenic acid (18:3) | g | 0.1 | 0.24 |
| Cholesterol | mg | 0.0 | 0 |
| Carbohydrates | g | 12.8 | 29 |
| Fiber | g | 4.4 | 10 |
| Calcium | mg | 47.1 | 107 |
| Magnesium | mg | 48.0 | 109 |
| Sodium | mg | 2.6 | 6 |
* Dried, roasted, unsalted, and shelled.
Table 1. Nutritional composition of pistachios for the 44 g snack and for 100 g.
2.3. Study design
The RCT was designed as a two-arm intervention comparing daily consumption of a pistachio snack in the experimental group versus no pistachio snack for control group. This intervention lasted 12 weeks and potential changes in body weight and composition, measured before and after the intervention, were compared between groups. In addition, all participants’ responses (changes in food intake and appetite) to the intake of the pistachio load were examined before and after the intervention. Total study duration was 16 weeks for each participant, including 2 experimental 2-day sessions conducted one week apart before the 12-week intervention and 2 identical experimental 2-day sessions conducted one week apart after the end of the intervention. Fig. 2 displays the experimental design.
.")
Fig 2. Study design and time course (flow chart).
2.4. Intake and appetitive responses to the pistachio load
The acute responses to the ingestion of the pistachio load were examined in all participants before and after the 12-week intervention. Two aspects were investigated: the potential adjustments in energy and food intake with versus without the pistachio load, and the changes in appetite sensations due to the ingestion of the pistachio load. In each of these weekly test sessions, food intake and appetite were examined first under laboratory conditions (breakfast and lunch on day 1) and then under free-living conditions (dinner on day 1 and whole day 2). During session 1 (week 1), half of the participants consumed a 44 g pistachio snack (250 kcal) at 10:00 in the lab (on day 1) and under free living conditions (on day 2). The other half followed the same experimental procedure but did not consume the snack. During session 2 (week 2), the participants who had not consumed the snack on week 1 were required to consume it at 10:00 on days 1 and 2 while participants who had had the snack on week 1 followed the experimental procedure without the snack This procedure was replicated exactly following week 12 of the intervention.
2.5. Nutritional intervention
The 12-week (84 days) nutritional intervention began immediately after the second 2-day test session of week 2. The participants were randomized into two study arms. Randomization was stratified by BMI and energy intake at baseline. To minimize the risk of a large baseline difference in mean BMI or mean habitual energy intake, the randomization of participants was made by the block method. As recruitment progressed, 14 blocks of 4 subjects each were successively formed. Blocks were formed by including subjects with contrasting (highest and lowest) BMI and baseline intake level. Then the 14 blocks and the 4 remaining subjects were assigned to one or the other group by random draw.
Participants assigned to the experimental group consumed a daily portion of 44 g pistachios as a mid-morning snack (between 10:00 and 10:30). They were requested to eat the portion in totality but whether they did or not, they were instructed to keep the bag containing the portion for future compliance check. Participants were provided with a log book and instructed to record the time of consumption of their morning snacks, along with any relevant information (adverse event, delay, etc.). Participants assigned to the control group were required to abstain from consuming nuts for the duration of the intervention, especially pistachios. However, they were free to have any other type of snack in accordance with their food habits.
To improve compliance during the 12-week nutritional intervention, all the participants returned to the laboratory every other week for a follow-up visit including an interview with one of the experimenters. During this visit, any potential adverse events or adverse effects were recorded and discussed and compliance was assessed.
All participants were instructed not to change their lifestyle (food and alcohol consumption, smoking, and physical activity) during the whole duration of the study.
2.6. Food intake measurements
During each 2-day test session, food intake was assessed on two successive days according to a procedure previously described (Fantino, Fantino, Matray, & Mistretta, 2018). For breakfast and lunch on day 1 food intake was measured under cafeteria-like laboratory settings. For dinner on day 1 and on day 2, under free-living conditions, food intake was recorded by the participants in a food diary.
On test day 1, participants arrived in the laboratory at 07:30 following an overnight fast and left the laboratory after 14:00. They were housed individually in a quiet room where they could have any sedentary activity of their choice. They were served their habitual breakfast at 8:00 and a buffet lunch at 12:00. For each participant breakfast was personalized, qualitatively and quantitatively, and reproduced their habitual consumption as reported in the baseline food intake survey. The lunch buffet included 50 items representing the major food groups of both sweet and savory options: dairy (yogurt, cheese), meat, grains, vegetables and fruits, as well as desserts and condiments. In keeping with the French cultural norms, both hot and cold foods were available. In order to avoid any ceiling effect, amounts served of each food option exceeded the usual serving at lunch time and extra-amounts remained available in case of unexpected request form the participants. The buffet offer was the same on each test day. Participants were instructed to eat ad libitum until they felt full. The amounts of all foods selected were weighted and recorded, and plate waste was measured. Plain water was available ad libitum at all time. Supplementary Table S1 provides the list, the composition and the origin of foods proposed at the lunch buffet. The following meals were ingested in free-living conditions. A registered dietician instructed the participants about weighing all the food they consumed at dinner on day 1 and on the next day (using a portable household scale lent by the research center) and reporting the quantity in a food diary (leftovers deducted).
Total energy, macronutrient (total lipids, protein and carbohydrates; mono- and disaccharides; saturated, monounsaturated and polyunsaturated fats) and micronutrients (thiamine, pyridoxine, riboflavin, potassium, zinc, magnesium, copper, manganese) intakes were computed. Energy and nutrient intakes computations were based either on the data provided on food labels or from the validated Nutri-7® software (Fantino et al., 2018; Fantino & Gourmet, 2008; Ghisolfi, Fantin, Turck, de Courcy, & Vidailhet, 2013) based on the CIQUAL French Food Composition Table (Tables Ciqual-Anses, 2017).
Adjustment for the energy and nutrients provided by the mandatory snack was computed before and after the 12-week intervention. Adjustment was calculated as the difference between the ad libitum energy intake (or macronutrient intake) over the 2-day session without experimental snack, minus intake over the 2-day session with snack. For this computation, the energy provided by the snack was not included (computation was based on spontaneous food intake). Adjustment was also expressed as a percentage of the additional energy provided by the snack.
The overall nutritional intake in both groups was also assessed. For this computation, the energy and nutrients provided by the snacks were included.
Appetite ratings were obtained during test day 1 in the laboratory. At 1 h intervals between 08:00h and 14:00h, and immediately after breakfast and lunch, participants rated subjective sensations of hunger, fullness, and desire-to-eat using digital Visual Analogue Scales (computer-administered touch screen measurements). Ratings were scored according to Blundell et al. (Blundell et al., 2010).
2.7. Anthropometric and body composition measurements
In addition to measurement at inclusion (visit V0), initial body weight (BW, ±10 g, electronic Metler-Toledo® scale, reference ID1 Plus) was measured between 9:00 and 10:00 h on the morning of day 1 of week 1, in underwear and empty bladder conditions. Final BW was measured under identical conditions on day 1 of week 16. Height (±0.5 cm) was measured at inclusion for the computation of body mass index (BMI, kg/m2). Initial and final horizontal body circumferences were measured by the same investigator (precision: ±0.1 cm) at the same time and under the same conditions as BW, with a flexible meter equipped with a winding device exerting a controlled and constant tension on the skin. Circumferences were measured at the following levels: waist at the narrowest level of the belly; hip circumference at the level of major femoral trochanters (i.e. the largest lateral diameter of the body); higher and lower thigh circumferences (right and left legs) respectively at half and a third of the distance between the upper edge of the patella and the umbilicus; arm at the level of maximum protrusion of the biceps.
Body composition was determined twice by the biphotonic absorptiometry technique (DXA). The first measurement occurred at the beginning of the study, during sessions 1 or 2 (week 1 or week 2); the second at the end of the study during sessions 3 or 4 (week 15 or week 16). The DXA were made using an osteodensitometer Discovery A from Hologic Inc (Marlborough, MA, USA) equipped with 64 photocells. Measurements were carried out in the morning between 9:30 and 10:30h in an approved radiology department, during the measurement sessions that did not involve ingestion of the pistachio snack (cross-over design) so that the snacks were ingested by the participants at the alternate session in the laboratory under the control of the experimenters. The analysis of body composition was made according to a tri-compartmental model: fat mass, lean mass and bone mineral content. The fat mass equates the mass of all the lipids present in the body, including membranous and cerebral lipids.
2.8. Statistical analysis
The primary objective was the demonstration that the daily consumption of the pistachio snack for 12 weeks would not induce weight changes significantly different from changes observed in the controls. To this aim, a non-inferiority statistical test was conducted comparing body weight before and after the intervention in both groups.
The sample size was computed according to Julious (Julious, 2004) using NQuery 7.0 software, considering a 10% non-inferiority margin, i.e. the maximum value over which two BW means can be considered not different according to the considered margin, with a 2-sided 5% type 1 error and a statistical power of 80%. The non-inferiority margin was determined according to the method prescribed by the Food and Drug Administration (FDA, 2016) and European Medicines Agency (EMA, 2005). The power calculation, based on previous weight variance obtained in our laboratory on a similar population, established that the planned equivalence/non-inferiority statistical tests required 25 women in each parallel group for BW comparisons with a non-inferiority margin set at 10% of the expected mean. Allowing for possible attrition, the final per protocol study sample was 60 women (ITT population, 30 in each parallel group). However, because there were 2 drop-outs after the first measurement week, the analysis population was the PPP (i.e. randomized participants) minus the drop-outs (i.e. experimental group: n = 29; control group: n = 29).
Computations of the sample size required for the non-inferiority statistical analysis were performed by the independent Clinical Research Organization RCTS® (38 Du Plat street, F- 69002 LYON, France), with the SAS® software, version 9.2. Other statistical analyses were performed with the NCSS® software (Number Cruncher Statistical System®, Statistical System of Windows, version 2017, Kaysville, Utah, USA). Statistical significance was determined by p < 0.05.
The main outcome measure was the comparison of BW before/after the intervention in both groups. The no-difference hypothesis was tested using an analysis of variance mixed model for parallel design with group (experimental or control) as main factor. Two-sided 95% confidence interval of the arithmetic BW means difference was compared with the 10% non-inferiority margins. Non-inferiority is confirmed when the upper 95% CI boundary of the arithmetic means of the difference between group is strictly lower than 10% of pre-intervention values as stated in the protocol.
Non-inferiority statistical analysis was only applied for the primary objective but could not be applied to the others outcomes because it would have required different population sizes than for the BW (primary objective). So descriptive statistics and mixed model ANOVAs, followed by appropriate post hoc comparisons by paired t-test were used to compare energy, macro- and micronutrient intakes and other anthropometric outcomes (body circumferences, body composition) in both groups before and after the intervention. The overall effect of the intervention on appetite ratings was evaluated comparing the 9 daily ratings (7 hourly ratings from 08:00 to 14:00h plus 2 post-meal ratings) of hunger, fullness and desire-to-eat recorded on day 1 in the laboratory at sessions with or without snack consumption.
Participants’ compliance during the 12-week intervention was assessed as the ratio of the number of 44 g pistachio portions consumed and the protocol requirements (1 snack/day for 84 days). Compliance was evaluated on the basis of the number of full bags provided to the participants of the experimental group at each follow-up visit and the number of full and empty bags returned at the next visit.
3. Results
Table 2 shows the participants’ characteristics at randomization (ITT population). No difference was observed between groups in terms of weight, BMI, age, daily energy intake, or TFEQ Restraint scores. Of the 60 participants included in the initial ITT population, one woman of the control group dropped out before measurement session 3 for personal reasons, and one of the experimental group for medical reasons; one additional participant of the control group failed to provide adequate food diaries and was therefore excluded by the main medical investigator from the computation of eating behavior parameters. Therefore, the PPP size was 29 per group except for food intake results (experimental n = 29, control n = 28).
| Characteristics | Control group n = 30 | Experimental group n = 30 |
|---|---|---|
| Age* (years) | 33 (1) | 30 (1) |
| Height* (cm) | 162.0 (1.19) | 162.9 (1.69) |
| Body weight* (kg) | 61.44 (1.41) | 62.65 (1.71) |
| Body Mass Index* (kg/m2) | 23.42 (0.49) | 23.60 (0.59) |
| Initial energy intake* (kcal) | 1680 (80) | 1679 (95) |
| TFEQ: Restraint score* | 4.9 (0.5) | 4.7 (0.4) |
TFEQ: Three Factor Eating Questionnaire (Stunkard & Messick, 1985).
* Means (SEM).
Table 2. Participants’ characteristics at randomization (ITT population).
Observed compliance over the full intervention, computed on the basis of the number of full bags provided and the number of full and empty bags returned at the next visit, was 97.2% (±0.8).
3.1. Body weight change (primary objectives)
BW decreased slightly, but not significantly, from the beginning to the end of the study in both groups (Table 3). Two-way ANOVA (mixed model with repeated measures over sessions) indicated no significant group or session effects, and no interaction between these two factors. In addition, the non-inferiority statistical analysis indicated that the upper 95% CI boundary of the BW difference between groups at the final measurement was strictly lower than the 10% non-inferiority margin. Thus there were no differences observed in weight changes between the groups.
| ITT population | ||
|---|---|---|
| Size | n = 60 | |
| Initial BW (arithmetic mean, kg) | 62.05 | |
| SEM | 1.10 | |
| 95% CI | 58.84–64.25 | |
| 10% non inferiority margin | 6.21 | |
| PP Population | ||
| Group | Experimental | Control |
| Size | n = 29 | n = 29 |
| Initial BW (arithmetic mean, kg) | 62.29 | 61.38 |
| SEM | 1.73 | 1.45 |
| 95% CI | 58.75–65.84 | 58.34–64.35 |
| Final BW (arithmetic mean, kg) | 62.16 | 61.01 |
| SEM | 1.80 | 1.60 |
| 95% CI | 58.46–65.85 | 57.73–64.29 |
| Mean difference | 1.15 | |
| SEM | 2.41 | |
| 95% CI | 3.68–5.98 | |
| Is the upper boundary of 95% CI below the 10% margin? (confirming non inferiority)* | Yes |
ITT: Intention to treat population.
PPP: Per protocol population.
* The non-inferiority is confirmed when the upper boundary of the 95% CI of the difference is lower than the non-inferiority margin.
Table 3. Non-inferiority statistical analysis of body weight (primary objective).
3.2. Anthropometric outcomes
A few body circumferences were slightly lower at the end of the study than at the beginning. ANOVAs (mixed model, group x sessions) revealed a significant session effect for only 3 circumferences: waist (F1,115 = 9.06, p = 0.004), higher right thigh (F1,115 = 6.04, p = 0.017), higher left thigh (F1,115 = 7.83, p = 0.007) and for the sum of the 8 body circumferences (F1,115 = 6.29, p = 0.015) due to a slight decrease in both groups. Only one significant group/session interaction was observed for the lower left thigh which decreased in the experimental group but not in the control group (F1,115 = 6.59, p = 0.013). Those differences are in line with the small (but not significant) BW decrease observed in both groups. DXA measurements revealed no significant changes in the fat or the lean body contents over the intervention.
3.3. Energy intake and adjustment
The three-way ANOVAs (mixed model) performed on ad libitum intake data recorded in 2-day test sessions did not reveal any significant group or session effect. The only significant effect found on most intake measurements was a snack effect (Lunch on day 1: F1,227 = 17.29, p < 0.001; Total of day 1: F1,227 = 7.11, p = 0.010; Total days 1 + 2: F1,227 = 9.25, p = 0.004). Consequently, data for both groups and initial and final sessions were pooled for the analysis of snack effects on lunch and dinner intake on day 1, day 2, and day 1 + day 2.
Fig. 3
displays the ad libitum energy intake observed during the test sessions and
Table 4
provides the % adjustment in energy intake observed after the pistachio load on the first and second days of test sessions.
 and on day 2 and on days 1 + 2 at sessions with snack and sessions without snack.")
Significantly different: ** p < 0.01; *** p < 0.001.
Fig 3. Energy intake at lunch and dinner (day 1) and on day 2 and on days 1 + 2 at sessions with snack and sessions without snack.
Table 4. Mean daily ad libitum energy intake at different moments over 2-day test sessions with or without pistachio snack and % adjustment for the extra energy provided by the morning snack.
| Lunch on day 1 | Dinner on day 1 | Total of day 1** | Total of day 2** | Total of days 1 + 2** | ||||||
|---|---|---|---|---|---|---|---|---|---|---|
| No Snack | Snack | No Snack | Snack | No Snack | Snack | No Snack | Snack | No Snack | Snack | |
| Energy intake (kcal)* | 677.2 ± 17.3 | 611.6 ± 17.5 (c) | 717.2 ± 31.6 | 681.6 ± 29.4 | 1822.4 ± 41.2 | 1721.1 ± 39.5 (b) | 1607.0 ± 48.4 | 1530.6 ± 51.1 | 3429.4 ± 71.9 | 3251.7 ± 70.6 (**) |
| Decrease of energy intake after snack | – 66.7 kcal (c) | – 35.6 kcal | – 101.2 kcal (b) | – 76.4 kcal | – 177.7 kcal (**) | |||||
| Adjustment: % of the extra energy provided by the snacks | 26.3% | 14.2% | 40.6% | 30.6% | 35.6% |
Two tailed paired t tests; (**) p < 0.01, (c) p < 0.001.
* Values are means (±SEM) after pooling initial and final measurements in both groups (Control + Experimental, i.e. per protocol population n = 57, energy provided by the snacks excluded).
** Total intake including breakfast (identical at session with and at session without snack).
The mandatory pistachio snack consumption was followed by a significant compensatory decrease in ad libitum energy intake at lunch on day 1 in the laboratory. The decrease corresponded to 26.3% of the extra energy provided by the snack (p < 0.001). A decreased energy intake was also observed at dinner on day 1 (14.2%) and on day 2 (30.6%), but did not reach statistical significance. However, the reduction was significant for the total energy intake on day 1 (40.5% of the snack energy, p < 0.01) and for the total energy intake on day 1 plus day 2 (35.5% of the snack energy load, p < 0.01).
3.4. Macronutrient intakes associated with snack consumption
Table 5 presents mean ad libitum macronutrient intakes on days 1 and 2, comparing sessions with and without snack, pooled across both groups and across initial and final sessions. The decrease in energy intake after the pistachio snacks resulted mainly from a decrease in carbohydrates intake and, to a lesser extent, in protein intake (Table 5).
Fig. 4 presents the total reductions in macronutrient intakes in graphic form.
Table 5. Mean daily ad libitum macronutrient intake at different moments over 2-day test sessions with or without the pistachio snack.
| Lunch on day-1* | Dinner on day-1* | Total of day-1*,** | Total of day-2*,** | Total of days 1+2*,** | ||||||
|---|---|---|---|---|---|---|---|---|---|---|
| No Snack | Snack | No Snack | Snack | No Snack | Snack | No Snack | Snack | No Snack | Snack | |
| Total carbohydrates (g) | 79.2 ± 2.1 | 70.6 ± 2.0 *** | 76.9 ± 3.4 | 76.4 4.2± | 223.5 ± 5.5 | 214.4 ± 6.3 | 187.3 ± 6.9 | 168.2 ± 6.4 ** | 410.8 ± 10.0 | 382.6 ± 10.4 *** |
| Mono & disaccharides (g) | 27.0 ± 1.2 | 24.5 ± 1.0 * | 38.1 ± 2.2 | 37.4 ± 2.6 | 96.2 ± 3.1 | 93.0 ± 3.5 | 86.9 ± 4.2 | 79.1 ± 3.7 * | 183.1 ± 6.0 | 172.1 ± 6.2 * |
| Polysaccharides (g) | 52.2 ± 1.7 | 46.0 ± 1.6 *** | 36.1 ± 2.5 | 35.0 ± 2.6 | 124.5 ± 3.8 | 117.3 ± 3.8 | 89.8 ± 4.7 | 81.6 ± 3.9 | 214.3 ± 6.7 | 198.9 ± 6.0 ** |
| Proteins (g) | 29.8 ± 0.9 | 27.0 ± 0.9 *** | 28.1 ± 1.4 | 27.3 ± 1.3 | 68.0 ± 1.8 | 64.5 ± 1.7 * | 62.5 ± 2.2 | 59.6 ± 2.3 | 130.5 ± 3.1 | 124.1 ± 2.9 * |
| Total lipids (g) | 23.8 ± 1.0 | 21.8 ± 0.9 * | 30.6 ± 2.0 | 28.0 ± 1.6 | 65.4 ± 2.3 * | 60.8 ± 1.9 | 64.7 ± 2.7 | 64.0 ± 3.0 | 130.0 ± 3.9 | 124.8 ± 3.8 |
| Saturated fat (g) | 10.3 ± 0.5 | 9.6 ± 0.4 | 11.3 ± 0.8 | 10.5 ± 0.6 | 28.3 ± 1.1 | 26.7 ± 0.9 | 25.6 ± 1.1 | 24.5 ± 1.2 | 53.9 ± 1.8 | 51.2 ± 1.6 |
| Monounsaturated fat (g) | 9.0 ± 0.4 | 8.0 ± 0.4 ** | 11.5 ± 0.9 | 10.3 0.8± | 23.7 ± 1.0 * | 21.5 ± 0.8 | 23.4 ± 1.3 | 23.7 ± 1.3 | 47.0 ± 1.8 | 45.1 ± 1.7 |
| Polyunsaturated fat (g) | 3.3 ± 0.2 | 3.0 ± 0.2 * | 4.1 ± 0.3 | 3.9 ± 0.4 | 8.2 ± 0.4 | 7.7 ± 0.4 | 8.5 ± 0.5 | 8.8 ± 0.6 | 16.7 ± 0.7 | 16.4 ± 0.8 |
| Fibers (g) | 7.5 ± 0.2 | 6.7 ± 0.2 ** | 5.7 ± 0.4 | 5.4 ± 0.3 | 16.7 ± 0.5 | 15.8 ± 0.6 | 12.7 ± 0.6 | 12.2 ± 0.6 | 29.4 0.9± | 27.9 1.0± |
- Two-tailed paired t-test; (*) p < 0.05, (**) p < 0.01, (***) p < 0.001.
- Nutrient composition data as indicated on food labels, except for monounsaturated fatty acids and polyunsaturated fatty acids that are not indicated on food labels and for which data of the ANSES-CIQUAL table were used.
* Values are means (±SEM) after pooling initial and final measurements of both groups (Control + Experimental, i.e. per protocol population n = 57).
** Total intake including breakfast (identical at session with and at session without snack).
Significant difference in macronutrient intakes: * p < 0.05; ** p < 0.01; *** p < 0.001.
Fig 4. Total difference in ad libitum macronutrient intakes over days 1 + 2, sessions with snack (nutrients from pistachios excluded) minus sessions without snack.
3.5. Snack effects on appetite ratings
In both groups and both initial and final sessions, snack consumption induced a highly significant change in appetite ratings until lunch. Hunger and desire-to-eat ratings decreased, while fullness increased. For each rated parameter, ANOVAs (mixed model) indicated, in addition of the significant effect of time of measurement, a significant effect of snack (Hunger: F = 33.34, p < 0.0001; Fullness: F = 52.97, p < 0.0001; Desire-to-eat: F = 58.81, p < 0.0001) and a significant interaction snack*time (Hunger: F = 38.23, p < 0.0001; Fullness: F = 24.98, p < 0.0001; Desire-to-eat: F = 43.38, p < 0.0001), but no effect of group or session. Following lunch, the effects of snack consumption on appetite ratings disappeared. Fig. 5 presents, as an example, the time course of hunger ratings at initial and final sessions for both groups. The time course of fullness and desire-to-eat ratings were very similar (Supplementary Figs. S1 and S2).
 at initial and final sessions for both groups.")
Fig 5. Time course of hunger ratings (VAS) at initial and final sessions for both groups.
3.6. Impact of the snack on total nutrient intakes
Table 6 presents total energy, macro- and micronutrient intakes at test sessions with and without the pistachio snacks, including nutrients provided by the pistachios (only micronutrients of interest were taken into consideration). Computations were done for total intakes on day 1, total intakes on day 2 and total intakes on day 1 + day 2. Since 3-way ANOVAs never showed any group or session effects, data were pooled across groups and sessions for the computations of snack effects.
Table 6. Total macro- and micro-nutrient intakes and energy intake. *
| Session | Total of day 1 | Total of day 2 | Total of days 1 + 2 | |||
|---|---|---|---|---|---|---|
| No Snack** | Snack** | No Snack** | Snack** | No Snack** | Snack** | |
| Macronutrients | ||||||
| Total carbohydrates (g) | 223.4 ± 5.5 | 227.1 ± 6.2 | 187.3 ± 6.8 | 180.9 ± 6.3 | 410.7 ± 10.0 | 408.1 ± 10.4 |
| Mono & disaccharides (g) | 96.19 ± 3.1 | 96.89 ± 3.5 | 86.91 ± 4.2 | 82.91 ± 3.7 | 183.1 ± 6.0 | 179.8 ± 6.2 |
| Polysaccharides (g) | 124.5 ± 3.8 | 118.9 ± 3.8 | 89.8 ± 4.7 | 83.3 ± 3.9 | 214.2 ± 6.7 | 202.2 ± 6.0 * |
| Proteins (g) | 68.0 ± 1.8 | 73.67 ± 1.7 ** | 62.5 ± 2.2 | 68.8 ± 2.3 | 130.5 ± 3.1 | 142.5 ± 2.9 *** |
| Total lipids (g) | 65.4 ± 2.23 | 80.6 ± 1.9 *** | 64.7 ± 2.7 | 83.7 ± 3.0 *** | 130.1 ± 3.9 | 164.3 ± 3.8 *** |
| Saturated fat (g) | 28.3 ± 1.1 | 28.9 ± 0.9 | 25.6 ± 1.1 | 26.7 ± 1.2 | 53.9 ± 1.8 | 55.6 ± 1.6 |
| Monounsaturated fat (g) | 23.6 ± 1.0 | 32.0 ± 0.8 *** | 23.4 ± 1.2 | 34.2 ± 1.3 *** | 47.0 ± 1.8 | 66.2 ± 1.7 *** |
| Polyunsaturated fat (g) | 8.2 ± 0.4 | 13.4 ± 0.4 *** | 8.5 ± 0.5 | 14.5 ± 0.6 *** | 16.7 ± 0.7 | 27.9 ± 0.8 *** |
| Linoleic acid (g) | 5.5 ± 0.3 | 11.01 ± 0.3 *** | 6.9 ± 0.5 | 12.9 ± 0.5 *** | 12.4 ± 0.6 | 24.0 ± 0.7 *** |
| Linolenic acid (g) | 0.89 ± 0.04 | 0.94 ± 0.05 | 0.69 ± 0.05 | 0.72 ± 0.03 | 1.58 ± 0.07 | 1.66 ± 0.06 |
| Micronutrients | ||||||
| Thiamine (mg) | 1.12 ± 0.08 | 1.30 ± 0.04 * | 0.98 ± 0.06 | 1.23 ± 0.04 *** | 2.10 ± 0.10 | 2.54 ± 0.06 *** |
| Pyridoxine (mg) | 1.73 ± 0.06 | 2.12 ± 0.06 *** | 1.38 ± 0.07 | 1.90 ± 0.07 *** | 3.12 ± 0.11 | 4.02 ± 0.10 *** |
| Riboflavin (μg) | 267.5 ± 12.4 | 261.9 ± 8.9 | 214.2 ± 14.1 | 227.4 ± 11.3 | 481.7 ± 21.5 | 489.2 ± 16.5 |
| Potassium (mg) | 2396 ± 71.6 | 2301 ± 67.3 | 2234 ± 82.4 | 2252 ± 91.2 | 4631 ± 126.5 | 4553 ± 133.6 |
| Zinc (mg) | 8.18 ± 0.28 | 8.76 ± 0.22 * | 6.43 ± 0.36 | 7.35 ± 0.30 | 14.62 ± 0.46 | 16.11 ± 0.39 ** |
| Magnesium (mg) | 245.7 ± 6.1 | 280.2 ± 5.9 *** | 223.6 ± 8.5 | 253.6 ± 7.3 ** | 469.4 ± 12.1 | 533.8 ± 10.8 *** |
| Copper (mg) | 1.03 ± 0.08 | 1.46 ± 0.07 *** | 0.87 ± 0.05 | 1.44 ± 0.05 *** | 1.90 ± 0.11 | 2.90 ± 0.10 *** |
| Manganese (mg) | 2.56 ± 0.10 | 3.00 ± 0.10 *** | 1.82 ± 0.10 | 2.31 ± 0.09 *** | 4.38 ± 0.15 | 5.31 ± 0.15 *** |
| Energy (kcal) | 1822 ± 41 | 1972 ± 39 *** | 1607 ± 48 | 1781 ± 51 *** | 3429 ± 72 | 3753 ± 71 *** |
- Snack versus no snack, Two-tailed paired t-test; (*) p < 0.05, (**) p < 0.01, (***) p < 0.001.
* Including energy and nutrients provided by the pistachio snacks.
** Values are means (±SEM) after pooling initial and final measurements of both groups (Control + Experimental, i.e. per protocol population n = 57), macronutrients provided by the snacks and breakfasts included.
In spite of the compensatory decrease in ad libitum intake, the consumption of several macro- and micro-nutrients (protein, total fat, MUFA, PUFA, linoleic acid, copper, magnesium, manganese, zinc, pyridoxine, and thiamine) was significantly increased. Intake of polysaccharides decreased slightly.
4. Discussion
In the present 12-week experimental intervention, the dietary supplementation of the ad libitum diet with a daily intake of 44 g pistachios (250 kcal), ingested as a morning snack, did not induce any change in body weight or body composition in healthy women, as evidenced by a non-inferiority statistical analysis. The examination of food intake at the beginning and at the end of the intervention showed an adjustment in spontaneous energy intake following the pistachio snacks, resulting mainly from a decrease in CHO intake. The compensatory decreases were the same before and after the 12 week intervention and in both the experimental and the control groups. Consistent observations of similar changes in appetite and intake have been reported following the consumption of almonds (Hull, Re, Chambers, Echaniz, & Wickham, 2015; Sayer et al., 2017; Tan & Mattes, 2013), hazelnuts (Pearson, Tey, Gray, Chisholm, & Brown, 2017), and peanuts (Devitt et al., 2011). These observations confirm that the recent recommendation made in many national guidelines to consume a daily portion of nuts (in the present case, pistachios) is likely to improve the nutritional content of the diet without inducing weight management problems, as adjustment of energy intake is observed both in early exposure to the pistachio supplement and after 12 weeks of daily intake.
In addition to the compensatory changes in ad libitum energy intake, the pistachio snack improved the dietary profile in many ways. Particularly, the diet was richer in many macro- (protein, fat, MUFA, PUFA) and micro-nutrients (linoleic acid, copper, magnesium, manganese, zinc, pyridoxine, and thiamine), supporting the recommendation of including a daily portion of nuts made by many public health authorities around the world (USA, Canada, and France among others). The healthy fatty acid profile, minerals, and phytochemicals in pistachios have a high antioxidant and anti-inflammatory potential (Bullo, Juanola-Falgarona, Hernandez-Alonso, & Salas-Salvado, 2015; Terzo et al., 2019).
Our results agree with previous reports of the weight and nutritional effects of adding portions of nuts or pistachios to the daily diet. Intervention studies with mandatory addition of nuts into the daily diet typically do not report any weight gain (Flores-Mateo et al., 2013; Fraser, Bennett, Jaceldo, & Sabate, 2002; Hollis & Mattes, 2007; Hull et al., 2015; Rock, Flatt, Barkai, Pakiz, & Heath, 2017; Wang, Li, Liu, Lv, & Yang, 2012). A recently published pilot study in healthy French women, in which a daily portion of pistachios was compared to an iso-energetic load of a comparator food (cheese biscuits) ingested in the afternoon, reported no change in body weight after four weeks (Carughi et al., 2019). In the PREDIMED study (PREvencion con Dieta MEDiterranea), a Mediterranean diet supplemented with nuts induced a decrease in central adiposity compared to the same diet supplemented with olive oil (Babio et al., 2014). Similarly, diet supplementation with pistachios did not lead to weight gain in patients with obesity (Li et al., 2010), metabolic syndrome (Gulati, Misra, Pandey, Bhatt, & Saluja, 2014; Wang et al., 2012), prediabetes (Hernandez-Alonso, Salas-Salvado, Baldrich-Mora, Juanola-Falgarona, & Bullo, 2014), diabetes (Sauder, McCrea, Ulbrecht, Kris-Etherton, & West, 2014), or hypercholesterolemia (Kay, Gebauer, West, & Kris-Etherton, 2010). In healthy volunteers, dietary and metabolic improvements (lipid profile, oxidative status, blood pressure) were obtained with 3–10 week pistachio supplementation without any increase in body weight (Burns-Whitmore, Towne, & Roy, 2017; Kocyigit, Koylu, & Keles, 2006; Sari et al., 2010).
The originality of our study is the parallel use of the DXA method for the analysis of body composition in addition to classic anthropometric measurements before and after the intervention, in combination with the measurement of compensatory changes in spontaneous energy intake following the pistachio snack in the morning. The changes in intake induced by the morning pistachio snack were followed over two consecutive days according to a complex protocol allowing a measurement of immediate adjustments of intake at the next meal (lunch intake measured under laboratory conditions) and continued assessment until the end of the following day (using a food diary completed by the participants under free living conditions). These parallel measurements (body weight/composition and ad libitum intake) allowed us to examine the contribution of intake adjustments in potential body weight changes. In this particular case, very little change was observed in terms of body measurements, suggesting that the energy load of the pistachio snacks was adequately compensated for by decreases in subsequent food intake. The decrease in energy intake was 26.3% of the pistachio load at the following lunch, in parallel with a strong decrease in hunger and desire to eat, and a strong increase in satiety sensations. After two days, the total level of adjustment was 35.5% of the estimated pistachio energy load. While these data suggest that compensation was not complete, earlier studies showed that delayed compensatory adjustments can be observed after 2–6 days with a maximum effect observed after a 3-day delay (De Castro, 1998; Champagne et al., 2013). It is thus possible that total energy adjustment was achieved over a number of days. It is also possible that the actual energy level of the pistachio load was overestimated if, as suggested by metabolic studies (Baer et al., 2012), their fat content is incompletely absorbed. In the present study, body weight data suggest that individuals fully adjusted over longer-term periods, so as not to be in positive energy balance.
The same level of adjustment before and after the intervention in the experimental group and in the controls showed that the compensatory response to the pistachio load was not sensitive to previous exposure to the daily consumption of the snack but rather occurred in response to the various satiety enhancing properties of pistachios: pistachios are rich in protein and fiber and require substantial chewing.
The very demanding experimental protocol, with parallel measurements of intake (both in the laboratory and under free-living conditions) and changes in body composition is a strength of the study. One potential weakness is the follow-up of compliance. Although many precautions were taken to optimize compliance (recording daily snack intake in a log book, phone reminders; regular visits to the lab and discussion with the team; return of pistachio bags, empty or not), it is impossible to ascertain the level of compliance, for lack of an adequate biomarker. The study included healthy women only, leaving open the generalization of findings to men, to younger and older age groups, and to individuals with specific health conditions (diabetes and obesity particularly). The 12-week intervention may have been too short to allow weight effects to develop, although the very strict non-inferiority margins tested in the present study strongly support the hypothesis of adequate compensation for the extra energy over extended periods of time. Of note, the present intervention was longer than previous studies of mandatory pistachio addition to the diet in healthy humans (Burns-Whitmore et al., 2017; Carughi et al., 2019; Kay, Gebauer, West, & Kris-Etherton, 2010; Sari et al., 2010).
5. Conclusions
The daily intake of 44 g pistachios as a mid-morning snack improved dietary nutrient profile without adversely affecting body weight control in healthy women, suggesting adequate compensation for the extra energy. These results, consistent with previous observations, support the recent public health recommendation to include a portion of nuts in the daily diet.
Author contributions
The authors’ contributions were as follows: MF and FB designed the study; MF and CB conducted the experiments; MF analyzed the data, MF and FM performed the statistical analysis, and MF and FB wrote the manuscript.
Funding
The study was funded by a grant from the American Pistachio Growers association (Fresno, CA, USA). The sponsors had no involvement in the study design or conduct, analysis of data, or the preparation or review of this manuscript.
Compliance with ethical standards
All procedures performed in the studies were in accordance with the ethical standards of the institutional research committee and with the 1964 Helsinki declaration and its later amendments. Informed consent was obtained from all individual participants included in the studies.
Declaration of competing interest
Marc Fantino and France Bellisle received honoraria and travel grants from the American Pistachio Growers Association. The other authors have no conflict of interest to disclose.
Acknowledgments
The American Pistachio Growers Association supplied the pistachio used in the study.
Appendix A. Supplementary data
The following is the Supplementary data to this article:
- Download : Download Word document (178KB)
Supplementary material.
References
- Babio et al., 2014 N. Babio, E. Toledo, R. Estruch, E. Ros, M.A. Martinez-Gonzalez, O. Castaner, et al.
Mediterranean diets and metabolic syndrome status in the PREDIMED randomized trial
Canadian Medical Association Journal, 186 (2014), pp. E649-E657
View PDFCrossRefView Record in ScopusGoogle Scholar
- Baer et al., 2012 D.J. Baer, S.K. Gebauer, J.A. Novotny
Measured energy value of pistachios in the human diet
British Journal of Nutrition, 107 (2012), pp. 120-125
View PDFView Record in ScopusGoogle Scholar
- Baer et al., 2016 D.J. Baer, S.K. Gebauer, J.A. Novotny
Walnuts consumed by healthy adults provide less available energy than predicted by the atwater factors
Journal of Nutrition, 146 (2016), pp. 9-13
View PDFCrossRefView Record in ScopusGoogle Scholar
- Baer and Novotny, 2019 D.J. Baer, J.A. Novotny
Metabolizable energy from cashew nuts is less than that predicted by Atwater factors
Nutrients, 11 (2019), p. 33, 10.3390/nu11010033
View PDFView Record in ScopusGoogle Scholar
- Bao et al., 2013 Y. Bao, J. Han, F.B. Hu, E.L. Giovannucci, M.J. Stampfer, W.C. Willett, et al.
Association of nut consumption with total and cause-specific mortality
New England Journal of Medicine, 369 (2013), pp. 2001-2011
View Record in ScopusGoogle Scholar
- Bes-Rastrollo et al., 2009 M. Bes-Rastrollo, N.M. Wedick, M.A. Martinez-Gonzalez, T.Y. Li, L. Sampson, F.B. Hu
Prospective study of nut consumption, long-term weight change, and obesity risk in women
American Journal of Clinical Nutrition, 89 (2009), pp. 1913-1919
View PDFCrossRefView Record in ScopusGoogle Scholar
- Blundell et al., 2010 J. Blundell, C. de Graaf, T. Hulshof, S. Jebb, B. Livingstone, A. Lluch, et al.
Appetite control: Methodological aspects of the evaluation of foods
Obesity Reviews, 11 (2010), pp. 251-270
View Record in ScopusGoogle Scholar
- Brennan et al., 2010 A.M. Brennan, L.L. Sweeney, X. Liu, C.S. Mantzoros
Walnut consumption increases satiation but has no effect on insulin resistance or the metabolic profile over a 4-day period
Obesity, 18 (2010), pp. 1176-1182
View PDFCrossRefView Record in ScopusGoogle Scholar
- Bullo et al., 2015 M. Bullo, M. Juanola-Falgarona, P. Hernandez-Alonso, J. Salas-Salvado
Nutrition attribute and health effects of pistachio nuts
British Journal of Nutrition, 113 (2015), pp. S79-S93
View PDFView Record in ScopusGoogle Scholar
- Burns-Whitmore et al., 2017 B.B.A. Burns-Whitmore, A.H. Towne, S. Roy
Hall LM pistachio consumption at 20% of energy does not significantly change body composition, blood pressure or blood lipids but improves diet quality in free-living, healthy college-aged women
Food Nutrition Journal (2017), 10.29011/2575-7091. 100030
FDNJ-130
- Carughi et al., 2019 A. Carughi, F. Bellisle, A. Dougkas, M.J. Feeney, A. Giboreau, J. Higgs
A randomized controlled study to assess effects of a daily pistachio (Pistacia vera) “goûter” (afternoon snack) on next-meal energy intake, satiety and anthropometry in French women
Nutrients (2019)
https://www.mdpi.com/2072-6643/11/4/767/pdf
- Cassady et al., 2009 B.A. Cassady, J.H. Hollis, A.D. Fulford, R.V. Considine, R.D. Mattes
Mastication of almonds: Effects of lipid bioaccessibility, appetite, and hormone response
American Journal of Clinical Nutrition, 89 (2009), pp. 794-800
View PDFCrossRefView Record in ScopusGoogle Scholar
- Champagne et al., 2013 C.M. Champagne, H. Han, S. Bajpeyi, J. Rood, W.D. Johnson, C.J. Lammi-Keefe, et al.
Day-to-day variation in food intake and energy expenditure in healthy women: The dietitian II study
Journal of the Academy of Nutrition and Dietetics, 113 (2013), pp. 1532-1538
ArticleDownload PDFView Record in ScopusGoogle Scholar
- De Castro, 1998 J.M. De Castro
Prior day's intake has macronutrient-specific delayed negative feedback effects on the spontaneous food intake of free-living humans
Journal of Nutrition, 128 (1998), pp. 61-67
View PDFCrossRefView Record in ScopusGoogle Scholar
- Devitt et al., 2011 A.A. Devitt, A. Kuevi, S.B. Coelho, A. Lartey, P. Lokko, N. Costa, et al.
Appetitive and dietary effects of consuming an energy-dense food (peanuts) with or between meals by snackers and nonsnackers
Journal of Nutrition and Metabolism, 2011 (2011), p. 928352
View PDFView Record in ScopusGoogle Scholar
- Dietary Guidelines for Americans, 2015 Dietary Guidelines for Americans
Available at: https://health.gov/dietaryguidelines/2015/resources/2015-2020_Dietary_Guidelines.pdf
(2015)
(last accessed March 28, 2019)
- EMA, 2005 EMA
European Medicines agency: Guidline on non-inferiority margin. EMEA/CPMP/EWP/2158/99
available at:
http://www.ema.europa.eu/ema/index.jsp?curl=documents/document_library/Scientific_guideline/2009/09/WC500003636.sjsp/ (27 July 2005)
(last accessed March 28, 2019)
- Fantino et al., 2018 M. Fantino, A. Fantino, M. Matray, F. Mistretta
Beverages containing low energy sweeteners do not differ from water in their effects on appetite, energy intake and food choices in healthy, non-obese French adults
Appetite, 125 (2018), pp. 557-565
ArticleDownload PDFView Record in ScopusGoogle Scholar
- Fantino and Gourmet, 2008 M. Fantino, E. Gourmet
[Nutrient intakes in 2005 by non-breast fed French children of less than 36 months]
Archives of Pediatrics, 15 (2008), pp. 446-455
ArticleDownload PDFView Record in ScopusGoogle Scholar
- FDA, 2016 FDA
U.S. Department of Health and Human Service. Non-inferiority clinical trials to establish effectiveness: Guidance for industry
(2016)
(last accessed March 28, 2019)
- Flores-Mateo et al., 2013 G. Flores-Mateo, D. Rojas-Rueda, J. Basora, E. Ros, J. Salas-Salvado
Nut intake and adiposity: meta-analysis of clinical trials
American Journal of Clinical Nutrition, 97 (2013), pp. 1346-1355
View PDFCrossRefView Record in ScopusGoogle Scholar
- Fraser et al., 2002 G.E. Fraser, H.W. Bennett, K.B. Jaceldo, J. Sabate
Effect on body weight of a free 76 Kilojoule (320 calorie) daily supplement of almonds for six months
Journal of the American College of Nutrition, 21 (2002), pp. 275-283
View PDFCrossRefView Record in ScopusGoogle Scholar
- Ghisolfi et al., 2013 J. Ghisolfi, M. Fantin, D. Turck, G.-P. de Courcy, M. Vidailhet
Nutrient intakes of children aged 1-2 years as a function of milk consumption, cows' milk or growing-up milk
Public Health Nutrition, 16 (2013), pp. 524-534
View PDFView Record in ScopusGoogle Scholar
- Grosso and Estruch, 2016 G. Grosso, R. Estruch
Nut consumption and age-related disease
Maturitas, 84 (2016), pp. 11-16
ArticleDownload PDFView Record in ScopusGoogle Scholar
- Gulati et al., 2014 S. Gulati, A. Misra, R.M. Pandey, S.P. Bhatt, S. Saluja
Effects of pistachio nuts on body composition, metabolic, inflammatory and oxidative stress parameters in asian Indians with metabolic syndrome: A 24-wk, randomized control trial
Nutrition, 30 (2014), pp. 192-197
ArticleDownload PDFView Record in ScopusGoogle Scholar
- Health Canada, 2019 Health Canada
Available at:
https://www.canada.ca/en/health-canada/services/canada-food-guide/resources/resources-download.html (2019)
(last accessed March 28, 2019)
- Hernandez-Alonso et al., 2014 P. Hernandez-Alonso, J. Salas-Salvado, M. Baldrich-Mora, M. Juanola-Falgarona, M. Bullo
Beneficial effect of pistachio consumption on glucose metabolism, insulin resistance, inflammation, and related metabolic risk markers: A randomized clinical trial
Diabetes Care, 37 (2014), pp. 3098-3105
View PDFCrossRefView Record in ScopusGoogle Scholar
- Hollis and Mattes, 2007 J. Hollis, R. Mattes
Effect of chronic consumption of almonds on body weight in healthy humans
British Journal of Nutrition, 98 (2007), pp. 651-656
View PDFView Record in ScopusGoogle Scholar
- Hull et al., 2015 S. Hull, R. Re, L. Chambers, A. Echaniz, M.S. Wickham
A mid-morning snack of almonds generates satiety and appropriate adjustment of subsequent food intake in healthy women
European Journal of Nutrition, 54 (2015), pp. 803-810
View PDFCrossRefView Record in ScopusGoogle Scholar
- Julious, 2004 S.-A. Julious
Sample sizes for clinical trials with normal data
Statistics in Medicine, 23 (2004), pp. 1921-1986
View Record in ScopusGoogle Scholar
- Kay et al., 2010 C.D. Kay, S.K. Gebauer, S.G. West, P.M. Kris-Etherton
Pistachios increase serum antioxidants and lower serum oxidized-LDL in hypercholesterolemic adults
Journal of Nutrition, 140 (2010), pp. 1093-1098
View PDFCrossRefView Record in ScopusGoogle Scholar
- Kocyigit et al., 2006 A. Kocyigit, A.A. Koylu, H. Keles
Effects of pistachio nuts consumption on plasma lipid profile and oxidative status in healthy volunteers
Nutrition, Metabolism, and Cardiovascular Diseases, 16 (2006), pp. 202-209
ArticleDownload PDFView Record in ScopusGoogle Scholar
- Kozimor et al., 2013 A. Kozimor, H. Chang, J.A. Cooper
Effects of dietary fatty acid composition from a high fat meal on satiety
Appetite, 69 (2013), pp. 39-45
ArticleDownload PDFView Record in ScopusGoogle Scholar
- Krop et al., 2018 E.M. Krop, M.M. Hetherington, C. Nekitsing, S. Miquel, L. Postelnicu, A. Sarkar
Influence of oral processing on appetite and food intake – a systematic review and meta-analysis
Appetite, 125 (2018), pp. 253-269
ArticleDownload PDFView Record in ScopusGoogle Scholar
- Li et al., 2010 Z. Li, R. Song, C. Nguyen, A. Zerlin, H. Karp, K. Naowamondhol, et al.
Pistachio nuts reduce triglycerides and body weight by comparison to refined carbohydrate snack in obese subjects on a 12-week weight loss program
Journal of the American College of Nutrition, 29 (2010), pp. 198-203
View PDFCrossRefView Record in ScopusGoogle Scholar
- Mattes and Dreher, 2010 R.D. Mattes, M.L. Dreher
Nuts and healthy body weight maintenance mechanisms
Asia Pacific Journal of Clinical Nutrition, 19 (2010), pp. 137-141
View Record in ScopusGoogle Scholar
- Natoli and McCoy, 2007 S. Natoli, P. McCoy
A review of the evidence: Nuts and body weight
Asia Pacific Journal of Clinical Nutrition, 16 (2007), pp. 588-597
View PDFView Record in ScopusGoogle Scholar
- Novotny et al., 2012 J.A. Novotny, S.K. Gebauer, D.J. Baer
Discrepancy between the Atwater factor predicted and empirically measured energy values of almonds in human diets
American Journal of Clinical Nutrition, 96 (2012), pp. 296-301
View PDFCrossRefView Record in ScopusGoogle Scholar
- O'Neil et al., 2015 C.E. O'Neil, V.L. Fulgoni 3rd, T.A. Nicklas
Tree nut consumption is associated with better adiposity measures and cardiovascular and metabolic syndrome health risk factors in U.S. Adults: NHANES 2005-2010
Nutrition Journal, 14 (2015), p. 64
View PDFView Record in ScopusGoogle Scholar
- Pearson et al., 2017 K.R. Pearson, S.L. Tey, A.R. Gray, A. Chisholm, R.C. Brown
Energy compensation and nutrient displacement following regular consumption of hazelnuts and other energy-dense snack foods in non-obese individuals
European Journal of Nutrition, 56 (2017), pp. 1255-1267
View PDFCrossRefView Record in ScopusGoogle Scholar
- Reis et al., 2013 C.E. Reis, D.N. Ribeiro, N.M. Costa, J. Bressan, R.C. Alfenas, R.D. Mattes
Acute and second-meal effects of peanuts on glycaemic response and appetite in obese women with high type 2 diabetes risk: A randomised cross-over clinical trial
British Journal of Nutrition, 109 (2013), pp. 2015-2023
View PDFView Record in ScopusGoogle Scholar
- Rock et al., 2017 C.L. Rock, S.W. Flatt, H.S. Barkai, B. Pakiz, D.D. Heath
A walnut-containing meal had similar effects on early satiety, CCK, and PYY, but attenuated the postprandial GLP-1 and insulin response compared to a nut-free control meal
Appetite, 117 (2017), pp. 51-57
ArticleDownload PDFView Record in ScopusGoogle Scholar
- Ros et al., 2014 E. Ros, M.A. Martinez-Gonzalez, R. Estruch, J. Salas-Salvado, M. Fito, J.A. Martinez, et al.
Mediterranean diet and cardiovascular health: Teachings of the PREDIMED study
Advances in Nutrition, 5 (2014), pp. 330s-336s
- Salas-Salvado et al., 2011 J. Salas-Salvado, P. Casas-Agustench, A. Salas-Huetos
Cultural and historical aspects of Mediterranean nuts with emphasis on their attributed healthy and nutritional properties
Nutrition, Metabolism, and Cardiovascular Diseases, 21 (Suppl 1) (2011), pp. S1-S6
ArticleDownload PDFView Record in ScopusGoogle Scholar
- Santé Publique France, 2019 Santé Publique France
Available at:
(last accessed March 28, 2019)
- Sari et al., 2010 I. Sari, Y. Baltaci, C. Bagci, V. Davutoglu, O. Erel, H. Celik, et al.
Effect of pistachio diet on lipid parameters, endothelial function, inflammation, and oxidative status: A prospective study
Nutrition, 26 (2010), pp. 399-404
ArticleDownload PDFView Record in ScopusGoogle Scholar
- Sauder et al., 2014 K.A. Sauder, C.E. McCrea, J.S. Ulbrecht, P.M. Kris-Etherton, S.G. West
Pistachio nut consumption modifies systemic hemodynamics, increases heart rate variability, and reduces ambulatory blood pressure in well-controlled type 2 diabetes: A randomized trial
Journal of the American Heart Association, 3 (2014), pp. 1-9
- Sayer et al., 2017 R.D. Sayer, J. Dhillon, G.G. Tamer, M.A. Cornier, N. Chen, A.J. Wright, et al.
Consuming almonds vs. isoenergetic baked food does not differentially influence postprandial appetite or neural reward responses to visual food stimuli
Nutrients, 9 (2017), p. 807, 10.3390/nu9080807
View PDFCrossRefView Record in ScopusGoogle Scholar
- Stunkard and Messick, 1985 A.J. Stunkard, S. Messick
The three-factor eating questionnaire to measure dietary restraint, disinhibition and hunger
Journal of Psychosomatic Research, 29 (1985), pp. 71-83
ArticleDownload PDFView Record in ScopusGoogle Scholar
- Tables Ciqual-Anses 2017 Tables Ciqual-Anses
Available at: https://ciqual.anses.fr/#/cms/download/node/20
(2017)
(last accessed March 28, 2019)
- Tan et al., 2014 S.Y. Tan, J. Dhillon, R.D. Mattes
A review of the effects of nuts on appetite, food intake, metabolism, and body weight
American Journal of Clinical Nutrition, 100 (1) (2014), pp. 412s-422s
- Tan and Mattes, 2013 S.Y. Tan, R.D. Mattes
Appetitive, dietary and health effects of almonds consumed with meals or as snacks: A randomized, controlled trial
European Journal of Clinical Nutrition, 67 (2013), pp. 1205-1214
View PDFCrossRefView Record in ScopusGoogle Scholar
- Terzo et al., 2019 S. Terzo, S. Balsassano, G.F. Caldara, V. Ferrantelli, G. Lo Dico, F. Mulè, et al.
Health benefits of pistachios consumption
Natural Product Research, 33 (2019), pp. 715-726
View PDFCrossRefView Record in ScopusGoogle Scholar
- Wang et al., 2012 X. Wang, Z. Li, Y. Liu, X. Lv, W. Yang
Effects of pistachios on body weight in Chinese subjects with metabolic syndrome
Nutrition Journal, 11 (2012), p. 20
ArticleDownload PDFCrossRefView Record in ScopusGoogle Scholar
☆ Abstracts presented at the “Journées Francophones de Nutrition”, Nice, France, November 28–30, 2018, Nutrition 2019, Baltimore, USA, June 8–11, 2019. and FENS 2019, Dublin.
1 Present address: Pr. Marc FANTINO, Fantino Consulting, 57 route de Charly (villa 27), F-69230, Saint Genis Laval, France.