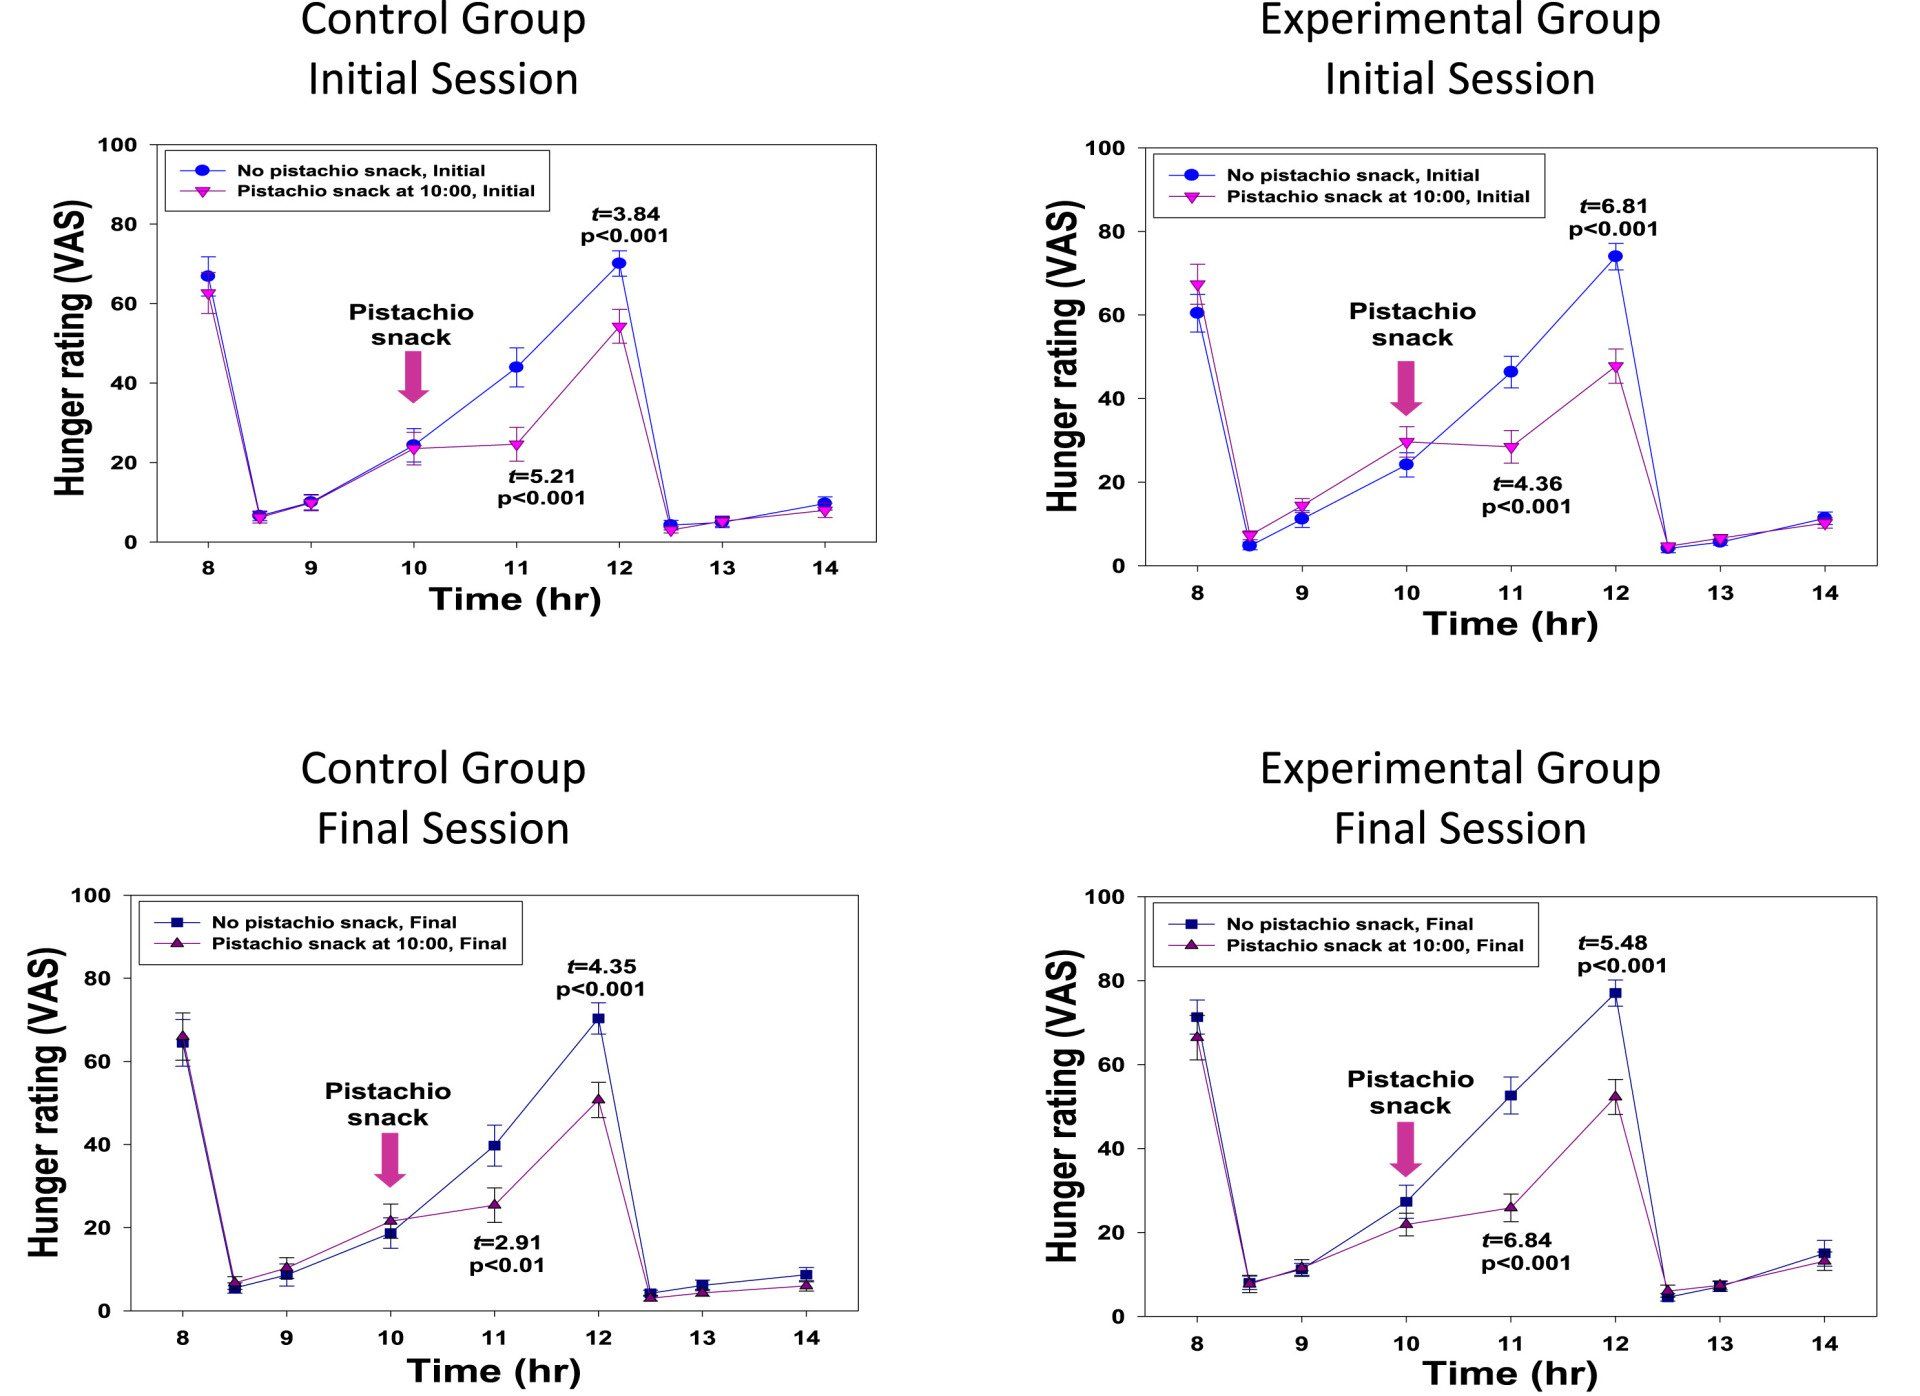
Fig. 5. Time course of hunger ratings (VAS) at initial and final sessions for both groups.

Significant difference in macronutrient intakes: * p < 0.05; ** p < 0.01; *** p < 0.001.
Fig. 5. Time course of hunger ratings (VAS) at initial and final sessions for both groups.

Significant difference in macronutrient intakes: * p < 0.05; ** p < 0.01; *** p < 0.001.
All Rights Reserved | Global Fruit & Nuts Ltd
Company Number 11912172
VAT Number 337249194